Edit: I changed Gnosis’ front page 50/ETH = $12.5 Mil for clarity and self containment.
Alright, so the Gnosis dutch auction reached their goal of 250K ETH in less than 15 minutes. I’m not too terribly surprised, to be honest, it was an incredibly popular project in the space.
$12.5 million in less than 15 minutes…
I was too late, because I was fiddling around with other things, like my job. But this gave me a fantastic opportunity to procrastinate and dive deeper into who bought in. To be a bit more precise, what does the distribution of auction’s transactions look like, and what can it tell us?
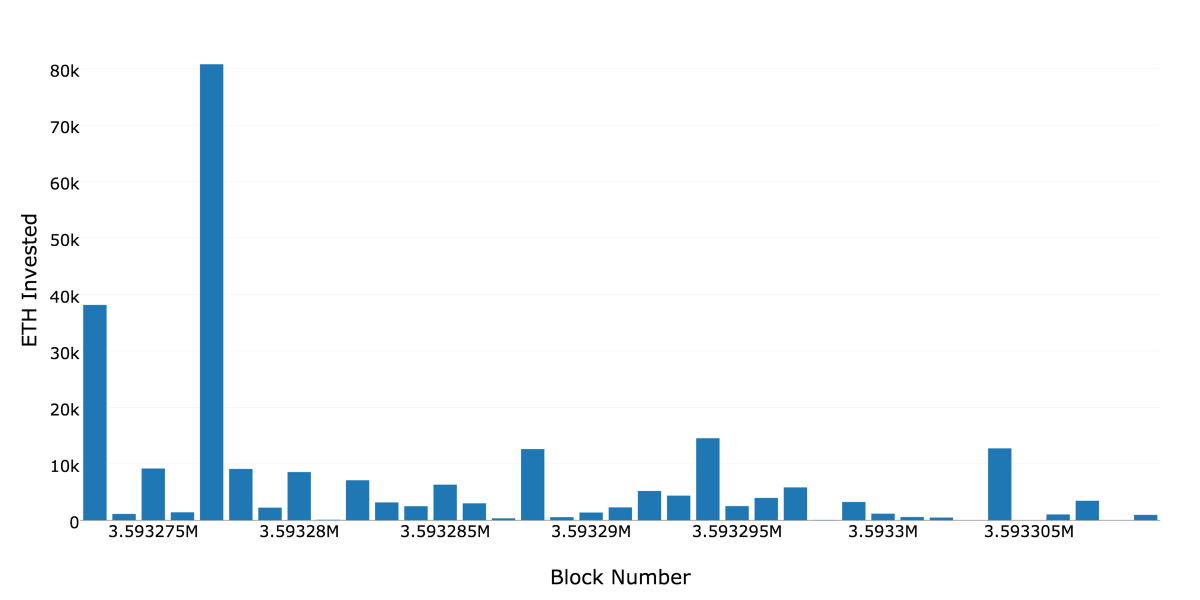
So I found the Gnosis wallet address (here), and looked at its internal transactions, which added up to exactly 250,000 ETH. I’ll discuss what this does and doesn’t give later in the blog. What I have here is a simple overview of transaction distribution throughout the window in which the auction was open.
Below we can see the amount of ETH deposited into the address, separated by block number:

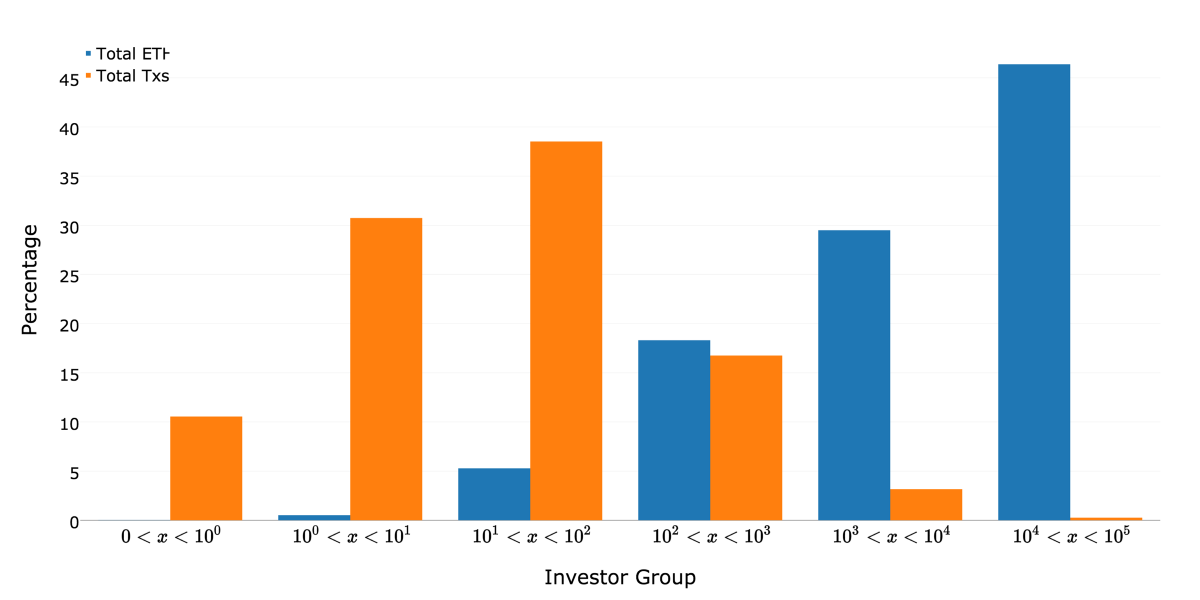
We can see that two of the blocks have the lion’s share of the investment, which begs one to see what the “user” distribution looks like. So then I broke up the individual investments in to separate categories. Each category is an investment in each order of magnitude of Ether.

So this plot shows us that over 40% of ETH invested in Gnosis was done by two single transactions. Since we are looking at the internal transactions of the contract address, it is not immediately apparent who they came from. Potentially exchanges, potentially Gnosis, potentially a super whale. More analysis would need to be done.
This plot also shows us that we are not so decentralized as a community, which needs to be kept in mind. As with most high level investments, the majority comes from a relatively small portion of the total pool of investors. It is important to note that investment opportunities are available to everyone now, as this is a technology of inclusion, but more than likely low-amount investors are simply along for the ride.
What this information does NOT show
Because I looked at internal transactions, I am not able to capture some phenomena, such as:
- multiple investments from the same party
This is typically in the form of a small amount first to test, and then the rest of the desired investment. We can assume that a good portion of the first group of people (transactions under 1 ETH) were exactly this. It is also interesting to note that because there was cap, and things went fast, it could be assumed that there is a non-trivial amount of people that got the first test transaction through, and then the auction ended before they could get the real one. - Any real world identification of investors
All of the information captured here is internal, so the “from” field is always the dutch auction contract, and not those sending the initial transaction. Further investigation could link the two, but this is quick and dirty, and I don’t have the time to do that (unless you pay me to ;) ) - Other stuff I don’t feel like discussing
This was just a curiosity of mine that I thought others would be interested to see. If you have questions or concerns on the conclusions I’ve drawn from the data, or how I plotted things, let me know and I’ll address them if they aren’t too trollish.